
Volvo Aero / LBP - Scientific Study
Affects of gravity-faciliated traction of the lumbar spine in persons with chronic low back pain at the worplace.
Authors:
MD; PhD Lennart Dimberg
Physiotherapist Lars-Göran Josefsson
PhD Bo Eriksson
© Mastercare AB/Nordisk Rygghälsa AB
© Mastercare AB Only to be used for Mastercare products.
Please note: Studies not valid for "similar" products due to the big difference in function and usage.
Abstract
A 12-month study was conducted to determine if gravity inversion at the workplace could prevent low back pain disorders from worsening. Employees with chronic low back pain disorders (LBP) were included. The participants were stratified by age, sex and worker category and randomized into three groups. Group 1 used the Swedish Mastercare Inversion System (SMIS) with inversion (head down) of 15 and 30 and a brief training program for 10 minutes daily; group 2 used it for 10 minutes twice daily and group 3 served as the control group. A questionnaire was used to obtain information on pain levels in a visual analogue scale and about sick days and sick-periods. The questionnaire was used at baseline, after 3 months and after 12 months. Back mobility was measured at baseline and after 3 months.
Result
116 persons were enrolled for the study. Of these, 108 (93%) completed the first three months and 92 (79%) completed the full 12 month schedule. At the start the participants averaged 44.1 years of age and 77% were men. A significant dose-related reduction in pain was noted for the training groups as compared to the control group after 3 and 12 months. Sick-leave due to LBP fell an average of 7.9 days per individual in the training groups compared to the year prior to the study, whereas control-group absenteeism increased. Forward flexion measured by finger-to-floor distance indicated increased backflexion, compared to baseline in the training groups but not in the control group.
Conclusion
Regular gravity inversion demonstrated a plausible remedial effect on low back pain and sick-leave was reduced. Key-words Low-back pain, inversion therapy, prospective study tilt table.
Introduction
In 1987 there were 14 million paid sick-days for low back pain (LBP) in Sweden, a nation with 8 million inhabitants (13). However, 70% of the sick-periods were shorter then 10 days ( 1). Out of 66 000 filed worker’s compensation claims in 1988, 41 000 were due to LBP (13). An estimated 15% of all sick-days in the USA in the early 1980s was due to LBP (13). Obviously LBP is a problem of major proportions for society and industry.
For Volvo Aero Corporation, with about 3 000 employees and 3 800 sick-days a year for LBP (1), an estimated $150 per sick-day means a loss of $570 000 per annum. If this absenteeism could be reduced by 10%, a net savings of $57 000 would be the result.
Inversion therapy of LBP has been used since the days of Hippocrates when the patient was hung upside down with his feet tied to the rungs of a ladder which was hoisted and dropped, imparting an abrupt tractive force to the spine (7). Since that time, various forms of traction equipment have been used and claimed to be effective in alleviating LBP (11). Frederick Sheffield designed a tiltable table with a highly-polished slippery top on which the patient was attached by a pelvic harness. By tilting the table head down 90, he could adjust the traction from zero to 50% of the patient’s own body weight (14). Gravity
inversion as self-treatment for LBP by means of inversion boots was popularized in the movie American Gigolo (9). Other traction equipment that has been used in scientific tests is the Backtrac, and the Back On-Track (2). Yet another principle of back traction not involving inversion, is illustrated by the Gravitational Lumbar Traction System developed by the Sister Kenny Institute. Here the user is suspended upright by a corset like vest worn around the rib cage. The weight of the lower part of the body supplies the traction force (2), much like the common practice of hanging from a door to relieve LBP.
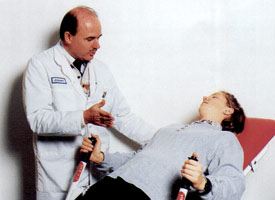
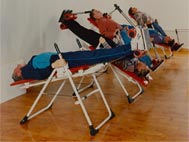
Most studies we have reviewed focused on the basic working principles of equipment, side effects and case reports but we have not been able to find any controlled prospective study on the clinical outcome of inversion therapy. The Swedish Mastercare Inversion system (SMIS) or Back-A Traction® is a self-usable table which pivots on a tubular steel frame and is tiltable to 15 and 30 (figure 1). It suspends its user from padded rollers clasping the ankles. The ankle support is adjustable to body lengths of 150-215 cm. The manufacturer claims it is easy to handle, safe, inexpensive and especially suitable for a workplace setting to alleviate the low back pain of employees with such problems. If regular use of the SMIS were to have a significant effect, it would be an efficient and cheap prophylaxis that would improve employee health and possibly reduce sick-day costs for the employer.
Aims of the study
A randomized, controlled trial with two training groups and one control group was conducted with the aim of assessing the effect of regular SMIS training on the pain level, back mobility and sickness absenteeism of chronic LBP patients.
Material and methods
Volvo Aero Corporation in Trollhättan, Sweden, manufactures, overhauls and repairs aircraft engines. Operations also include development and production covering space vehicle components, hydraulics, diesel engine components and boat heaters. In 1992 the company employed nearly 3 000 persons, all naturalized Swedish citizens. About 1/3 were white collar workers and approximately 15 % were women. Most employees (90%) used the company medical facility for their medical problems.
Inclusion criteria
Employees that had undergone medical treatment for LBP at the company medical department during the last 3 years with 1. on going LBP and/or 2. LBP more than 3 months during the previous 3 years and/or 3. LBP more than 1 week more than once during the previous 3 years.
Exclusion criteria
Unwillingness or lack of time to participate. On-going full-time sick-leave at the start of ale study. Other concomitant severe medical condition. Employees with the above criteria were drawn from the medical appointment statistics and randomized into 3 groups: group 1 used the inversion system for ten minutes once daily on paid working time, group 2 used the system for ten minutes twice daily and group 3 served as the control group. The groups were stratified based on three criteria: age, gender and worker category (blue- or white collar). Invitations to participate were mailed to the workplace of fifty individuals for each group, also asking them to attend briefings tailored to each group, explaining the study in detail and what was expected from each individual. After the briefing they voluntarily signed on to participate in the study. All employees using the SMIS were first given detailed instructions including certain exercises, by a Mastercare representative who monitored the training during the first week. Each treatment consisted of 15 inversion for 5 minutes including exercises and then 30 for another 5 minutes relaxation. Fifteen tables were set up in the company gym, available any time of day, within 10 minutes walking distance from the most distant part of the company. All training was recorded on each visit by personal punchcard. Patients training once daily usually did so in conjunction with their lunch (11 am to 1 pm) and those training twice daily usually did their second round at the end of the work day (3-5 pm). However, they were given considerable freedom to schedule training at their convenience. The program started on August 1, 1992. An in-depth follow up was carried out after 3 months (this period was mandatory), and a final follow up was carried out in late September, 1993.
Measurements
Since the participants were drawn from the medical files, all had been previously examined for their back complaints by the occupational physicians and were x-rayed to exclude malignancy. At baseline, information was gathered by questionnaire (1) under a nurse’s supervision concerning age, sex, worker category, pain level (previous week’s pain on a scale of 0 to 10) using a Visual Analogue Scale (5), functional level, medication and other treatment, sick-leave during the previous six months and other medical complaints. Also compiled were the frequency of headache on a Visual Analogue Scale (from 0=none to 10=very often), neck/shoulder problems and pain level, and the frequency of other locomotor pain during the previous month. A pain drawing was also completed (15). The result was classified into two variables. The first was coded by pain distribution: local back pain only, rhizopathy in leg and a combination of the two with other locomotorpain.
The second variable was coded by pain modality: 1 equals one modality; 2 equals two and 3 equals three or more modalities. Measurements of hack mobility were taken in a semi-randomized fashion out of group order, using the standardized Mildenberg finger-floor method and the Schober test (12). The Schober test was conducted as follow: with the patient standing upright, a mark was made on the skin at the level of the dimples of Venus, which approximates L5. A second mark was made 10 cm above and a third mark 5 cm below the first mark. Then the patient bent forward with the knees straight, reaching as far as possible towards the toes. The increase between the upper and lower mark was taken as a measurement of lumbar flexion. The finger-floor measurements were taken on both sides upon the first attempt of the patient to bend forward with extended knees until stopped by pain or muscle spasm. Blood pressure in the supine position and intraocular pressure by applanation tonometry were screened with norms at systolic of <160 and diastolic<100 mm Hg, and <20 mm Hg respectively.
After 3 months the above procedure was repeated and information on the number of training episodes was compiled. Subjective impression of the equipment, side-effects and free comments were also gathered at this time. The nurse was blinded to the previous measurements of back mobility, but due to familiarity with the patients it was impossible to blind her from who were training or not. But, to avoid inter-observer variability the same nurse always handled the same patient.
After one year there was a follow up including the number of training episodes, number of sick-days and periods for low back pain, changes in medication over the previous 9 months, subjective impression of the effect of training on well- being and pain parameters of the different parts of the locomotor system the previous month on the Visual Analogue Scale described previously. No mobility measurements were taken.
Statistical methods
Comparisons of the groups were made using conventional statistical tests. In change comparisons, adjustments were made for age, sex, working category and initial value. The analysis reference was made for both group 1 and 2 together (combined training group). All tests were two-sided. Statistical significance was taken as p<0.05 unless otherwise stated.
Results
Of the 150 persons that were asked, 116 enrolled in the study, and 108 (93%) completed the mandatory 3 month study. The distribution of these participants
and the baseline parameters are shown in table 1. Ninety-two persons (79%) completed the 12 month study.
Drop-outs
Eight persons entered the study but did not complete the treatments. Two of these experienced more pain after some initial inversion treatments, two felt dizziness near fainting after the inversion and two did not have time to come to the treatments. In addition, two individuals from the control group refused to come to the follow up. The drop-outs did not significantly differ from the other participants with regard to sex, age, or worker category.
No severe concomitant disease was found, All patients had normal blood pressure (<160/90). One patient had a slightly elevated intraocular pressure but was cleared by his ophtalmologist for the study.
All results after 3 months are presented in table 2 and after 12 months in table 3. The average variables ”pain last week” and ”pain affecting daily activities” decreased significantly for group 2 and the combined training group after three months compared to baseline, and increased slightly for group3 (control group) as is evident in figure 2. The finger-floor distance decreased in the training groups indicating increased back-mobility after 3 months, and was different from the control group, where it increased somewhat as illustrated in figure 3. ”Low back pain last month” after 12 months decrease significantly more for the combined group compared to the control group.
Average sick-days per participant and month for low back pain and totally 6 months prior to the study (baseline) and during the 12 months of the study are shown as percentages of baseline values in figure 4. After 12 months there was a slight increase in sick-days for LBP in group 1, training once daily, a clear decrease in group 2 training twice daily, and an increase in group 3, the controls, as compared to baseline. In the combined training group the difference from baseline in lost sick-days per month due to low back pain during the 12month study was 7.9 days per participant. A downward trend was shown for average length of sick-periods for LBP after 12 months in both training groups as opposed to the control group, figure 5. The 12-month changes in sick-periods and sick-days were significant between group 1 and 2 and the control group. Seventy-one percent of the participants in group 1 and eighty-six percent in group 2 reported a positive effect from SMIS therapy. The most common reasons for not continuing regular use of the equipment in spite of the good effects reported were lack of time, laziness (20 participants), healed back (5 persons) and negative effects – worse back or ankle and muscle pain – (9 persons). No serious negative side-effects were reported.
Discussion
This study has shown a significant, dose-related reduction of pain index for the training groups compared to the control group, an increase in lumbar flexion as finger floor distance after 3 months and a reduction of ”low back pain last month”. The increase of back mobility shown by reduction of finger-floor distance compared to baseline was not supported by an increase in the Schober test. This may indicate that the mobility increase was mainly from the hamstrings. Over the years, there has been considerable discussion on the mechanisms of spinal traction-what does it do and how does it relate to pain? This is not an easy question to answer especially since, according to Nachemson, a clear diagnosis for about 70 % of the patents with low back pain will never be established (13). Kane (8) relates studies involving x-ray of the lumbar spine before and after traction showing a lumbar segment separation of 1-2 mm using 35-150 kg traction. Other studies have shown reduction of herniated discs on CAT scan and confirmed vertebral distraction after autotraction (11, 3, 6). Whether the proposed effect of traction in this study was due to this or an increase in intervertebral foramina height enlarging space for nerve roots or degenerative joints (3), or stretching of the paraspinal lumbar muscles when the cause of pain is muscle spasm, or the anterior or posterior longitudinal ligaments (14), or a general relaxation effect or a combination of these is pure speculation. No-one has shown how large a vertebral separation is needed to give a therapeutic effect and it seems reasonable to assume that the distraction of vertebrae is a continuous variable and not an ”all or nothing” phenomenon. In addition to this, all patients using the SMIS also performed a set of motions tailored to enhance the effect of the traction. The participants in this study had chronic LBP from various causes, discogenic and non- discogenic, and it has not been the aim of this study to prove exactly which of the above hypothesized effects were working for fee individual patient.
Over the 12 month period there was an insignificant increase in sick-days for LBP in group 1, a more pronounced reduction in group 2, and an increase in group 3. This dose-response tendency in relation to the control group may support a real relationship. However, the finding must be interpreted with caution. Reporting in sick is influenced by many other factors such as social attitudes to work, type of work and life style, and there may be other explanations to the findings than the effects of treatment (1). From our previous work in sickness absenteeism it is our experience that the number of sick-periods has been a better measurement of treatment effect than the number of sick-days, due to the fact that a few patients with very long sick periods may throw off the average number of sick-days per participant. The change of sick-periods shown in figure 5 is consistent, with a significant reduction in LBP for group 1, which also supports the finding that this could be an effect of the treatment.
It may be argued that it is impossible to decide whether the suggested effect on low back pain by SMIS was due to the inverse traction itself or to the training program that was also conducted and that such an effect might be obtained by the exercise program alone. According to Nachemson, however, no back school has been proven to be effective thus far(13). On the other hand the effect might be due to a combination of the traction and training, and it must be emphasized that the special pivotal design of the table was essential to the effectiveness of the training.
Caution has been suggested for the following patient populations: increased intraocular pressure, hypertension, uncompensated heart failure, carotid artery stenosis, hiatal hernia or spinal instability and people receiving anticoagulants, chronic headache, artificial hip replacements, motion sickness and chronic sinusitis (9, 10, 4, 16, 8).
In our study we have not included any patients with high blood pressure. The most common side-effects have been dizziness, orthostatic reaction (2 patients), pain in ankles, knees or muscles (4 patients) and increased back pain (4 patients). No serious side effects were documented.
References
1. Dimberg L, Olafsson A, Stefansson E et al: Sickness absenteeism in an engineering industry – an analysis with special reference to absence for neck and upper extremity symptoms. Scand JSoc Med 17:77-84, 1989.
2. Gianakopoulos G, Waylonis G, Grant P: Inversion devices: their role in producing lumbar distraction. Arch Phys Med Rehabil 66:100-102, 1985.
3. Gianakopoulos G, Waylonis G, Grant P: Inversion devices: their role in producing lumbar distraction. Arch Phys Med Rehabil 68:100-102, 1985.
4. Goldman RM, Tarr RS, Pinchuk BG et al: More on gravity inversion, West J Med 141, 1984.
5. Huskinsson EC: Visual Analogue Scales in Melzach R (Ed): Pain measurement and assessment. Raven Press, 1983, pp 33-37).
6. Judovich BD: Lumbar traction therapy and dissipated force factors. J Lancet 74:411-414, 1954.
7. Kane M, Karl R. Swain J: Effects of gravity-facilitated traction on intervertebral dimensions of the lumbar spine. JOSPT6(5):281-288, 1985.
8. Klatz RM, Goldman RM, Tarr RS: Gravity inversion therapy. West J Med 11:538-540, 1983.
9. Klatz R, Goldman R, Pinchuck B et al: Effects of gravity inversion on hypertensive subjects. The physician and sports medicine 13 (3):85-89, 1985.
10. London GM, Levenson JA, Safar ME et al: Hemodynamic effects of head-down tilt in normal subjects and sustained hypertensive patients. Am J Physiol 245:194-202, 1983.
11. Mathews J: Dynamic discography: a study of lumbar traction. Ann Phys Med 9:275-279, 1968.
12. Mildenberg F: Back mobility. Compendium, Skönvik Rehabcenter, 35-44, 1991.
13. Nachemson A: Low Back Pain – a societal problem, The Swedish Council on Tecnology Assessment in Health Care, 1 200, 199l.
14. Sheffiel F: Adaptation of tilt table for lumbar traction. Arch Phys Med Rehabil 14:469-472, 1964.
15. Sivik T, Gustafsson E, Klingberg K: Differential diagnosis of low-back pain patients. A simple quantification of the pain drawing. Nord J Psychiatry 46: 55 – 62, 1992.
16. Zito M: Effects of two gravity inversion methods on heart rate, systolicbrachial pressure, and ophtalmic artery pressure. Therapy 68:20-25, 1968.
Baseline parameters
Group 1 training once daily, group 2 training twice daily, group 3 is the
control group. Figures in parentheses are Standard Deviation.
means statistically significant vs control group (p<0.05)
TABLE 1
Group 1 2 3
No 35 34 39
Age 43.4 (11.1) 44.0 (10.9) 45.0 (11.1)
% males 86 76 69
% blue-collar
workers 66 53 72
Average number of
sick-days per participant
and month (last 6 months)
total 0.647 1.931 0.547
of which for LBP 0.132 1.420 0.128
Average number of
sick-periods per participant
and month (last 6 months)
total 0.177 0.184 0.173
of which for LBP 0.025 0.058 0.043
VAS most painful
movement last week
0 = no pain,
10 = intolerable pain 2.3 (2.3) 1.8 (1.9) 1.4 (1.7)
VAS average pain last
week 1.7 (1.9) 1.9 (2.0) 1.0 (1.5)
Pain affecting daily
activities last week
0 = no affection,
5 = can’t do anything 1.9 (0.9) 2.1 (0.9) 1.8 (0.9)
TABLE 1 CONT 1
Group 1 2 3
Headache last month
0 = never, 10 = often 1.9 (2.7) 1.3 (1.4) 1.9 (2.8)
Neck/shoulder problems
last month
0 = never. 10 = often 2.9 (3.4) 3.1 (3.9) 3.0 (3.6)
Average neck/shoulder
pain last month
0 = no pain, 10 = into-
lerable pain 2.6 (2.9) 2.1 (2.5) 1.8 (2.0)
LBP last month
0 = never, 10 = often 3.5 (3.4) 4.9 (3.5) 3.5 (3.3)
LBP last month
0 = no pain,
10 = intolerable pain 3.2 (2.7) 3.7 (2.2) 2.7 (2.9)
Other muscular pain last
month 0 = never, 10 = often 1.6 (2.9) 0.8 (1.7) 2.0 (3.2)
Pain distribution (pain
drawing) at study start
(%)
No LBP 26 9 21
LBP only 29 38 10
LBP and pain in leg 0 6 0
LBP and other pain locations 45 47 69
TABLE 1 CONT 2
Group 1 2 3
Low back pain modalities
(aching, burning,
numbing, cutting,
stitching, cramping)
(%)
No pain 26 9 23
One modality 43 29 26
Two modalities 26 41 31
Three or more modalition 5 21 20
Use of pain medication
(%)
daily 0 0 3
sometimes 34 41 36
never 66 59 61
Other back treatment
last month (%) 6 21 10
TABLE 2
Three month follow up
Group 1 trained once daily, group 2 twice daily and group 3 was the control
group. Parentheses are percentages of baseline values.
means statistically significant change to baseline p<0.05 and (*) means
significant change between both training groups together and the control
group and **p<0.0l.
Group 1 2 3
No 35 34 39
Average no of
training periods per
participant
total 40 75 0
per week 4.0 8.1 0
Most painful
motion last week
0 = no pain. 10 =
intolerable pain 1.5 (65) 0.8 (44) 1.2 (86)
Average pain last
week 0 = no pain,
10 = intolerable pain 1.4 (82)(*) 0.9 (47)** 1.2 (120)
Pain affecting daily
activities last week
from 0 = no
disturbance, 5 = can’t
do anything 1.7 (89)(*) 1.4 (67)** 1.7 (94)
Use of pain medication
%
Daily 0 0 0
Rarely 31 35 45
Never 69 65 55
TABLE 2 CONT 1
Group 1 2 3
Other treatment last
3 months
% 9 0 8
Headache last month
from 0 = never, 10 =
very often 1.5 (79) 1.2 (92) 1.6 (84)
Neck/shoulder pain
last month
from 0 = never,
10 = very often 1.2 (41) 1.6 (52) 2.2 (73)
Neck/shoulder pain
last month from 0 =
no pain, 10 = into-
lerable pain 1.2 (46)** 1.2 (57) 1.8 (100)
LBP last
month from 0 = never,
10 = very often 3.4 (97) 2.5 (51) 3.2 (119)
LBP last
month from 0 =
no pain, 10 = into-
lerable pain 2.4 (75) 2.3 (62) 2.5 (93)
TABLE 3
12 month follow up.
Group 1 trained once daily, group 2 twice daily and group 3 was the control
group. Within parentheses are the percentage of baselinevalues. * Means
significant change to baseline as compared to the control group p<0.05 and
**p<0.01. (*) Means significant change between both training groups together
and the control group.
Group 1 2 3
No 28 29 35
Average number of
training periods per
participant during last
9 months
per week 1.9 1.9
Has the training
affected your well-
being
%
No difference 18 7
Positively 71 86
Negatively 11 7
Has your pain
medication changed
during the last
3 months?
%
no 93 90 94
yes, increased 0 0 0
yes, decreased 7 10 6
Headache last month
( ) means % of baseline
0 = never, 10 = often 0.7 (41)* 1.4 (100) 1.7 (81)
Table 3 cont 1
Group 1 2 3
Neck/shoulder problems
last month
( ) means % of baseline
0 = never, 10 = often 1.4 (48) 1.4 (45) 1.9 (73)
Average neck/shoulder
pain last month
( ) means % of baseline
0 = no pain, 10 = into-
lerable pain 1.2 (46)* 2.2 (110) 2.0 (125)
LBP last month
( ) means % of baseline
0 = never, 10 = often 2.7 (71) 2.0 (43)** 3.6 (100)
LBP last month
( ) means % of baseline
0 = no pain
10 = intolerable pain 2.4 (74)(*) 2.4 (63)(*) 3.4 (123)
Other muscular pain last
month
( ) means % of baseline
0 = never, 10 = often 0.9 (76) 0.9 (119) 1.7 (92)